
這是我的部落格所綻放出的花朵!^^
在友站(Kaida’s Conscious Choices:Blog 結構圖與隱藏 NavBar 功能)發現這個用來分析網頁結構的網站:Websites as Graphs。
首先,進入到Websites as Graphs的首頁後,將您欲分析的網站的網址鍵入(如下圖所示),然後,系統將會為您分析該網站的結構。

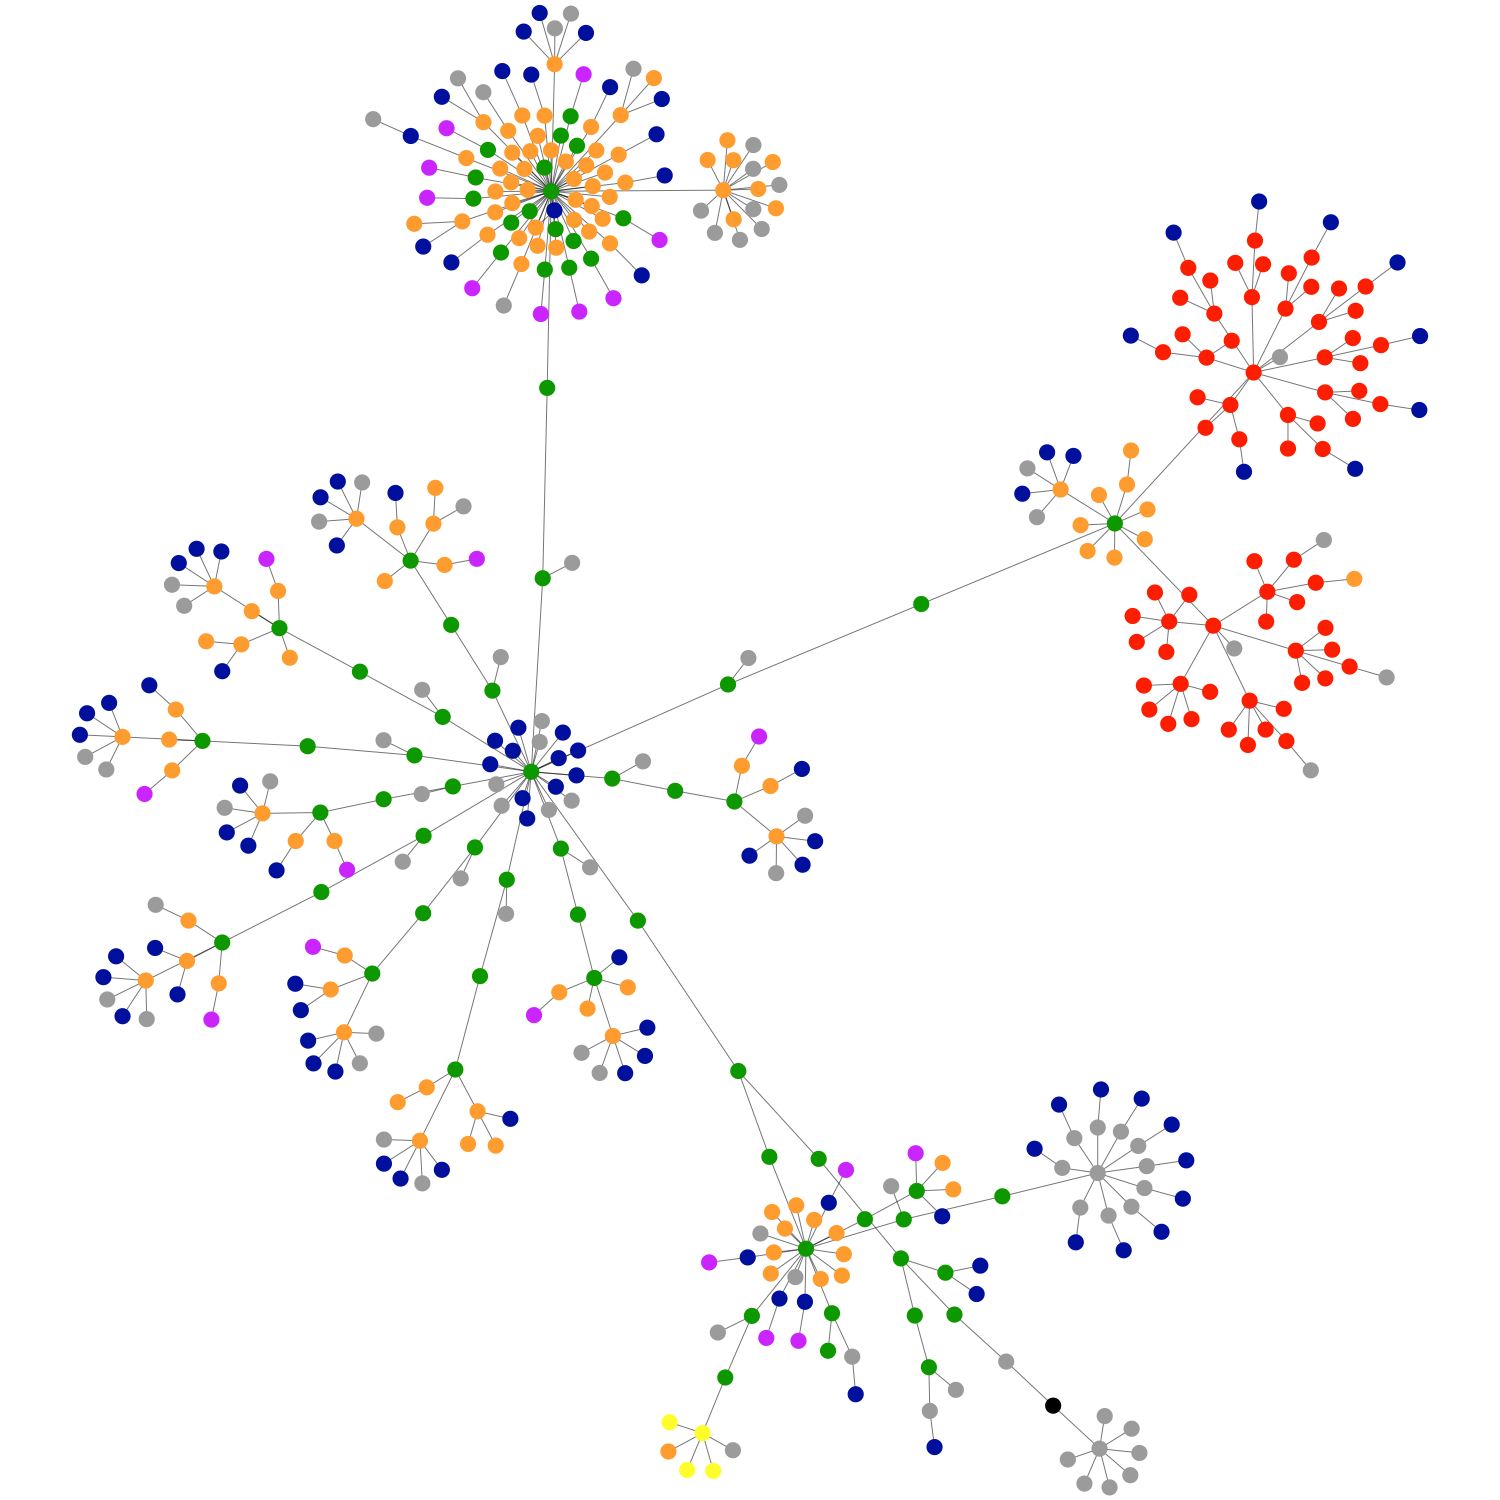
分析圖上的顏色分別具有其特殊意義(What do the colors mean?),說明如下:
- blue: for links (the A tag)
- red: for tables (TABLE, TR and TD tags)
- green: for the DIV tag
- violet: for images (the IMG tag)
- yellow: for forms (FORM, INPUT, TEXTAREA, SELECT and OPTION tags)
- orange: for linebreaks and blockquotes (BR, P, and BLOCKQUOTE tags)
- black: the HTML tag, the root node
- gray: all other tags
註:該網站有提供原始碼供使用者下載喔!